Indifference Curve: A Simple, Explanation
Whenever you choose between two things — say coffee vs. tea, or pizza vs. burgers — you’re making decisions based on what gives you the same level of satisfaction.
Economists have a fancy way of showing this idea, and it’s called an Indifference Curve.
Don’t let the term scare you. It’s actually a pretty natural concept once you understand the vibe behind it.
What Is an Indifference Curve?
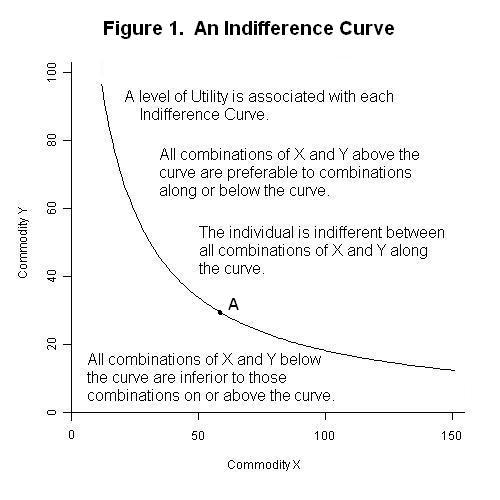
An indifference curve shows different combinations of two goods that give a consumer the same level of satisfaction.
Think of it like this:
If you get the same happiness from:
- 2 coffees + 1 donut, and
- 1 coffee + 2 donuts,
then both these combos belong on your indifference curve.
You don’t “prefer” one combination over the other. You’re indifferent between them — that’s why it’s called an indifference curve.
Why Indifference Curves Matter
They help us understand:
- Why consumers switch between goods
- How preferences work
- How people make choices under budget limits
- Why some combos feel “better” than others
Economists use these curves to capture real human behavior — the way we trade off one thing for another while trying to stay happy.
Key Features of Indifference Curves
1. They Slope Downward
If you want more of one good, you must give up some of the other to stay at the same satisfaction level.
More burgers = fewer pizzas.
That downward slope shows your trade-off.
2. Higher Curves Mean Higher Satisfaction
An indifference curve above another one represents more happiness.
Example:
A curve that includes “4 pizzas + 3 burgers” is better than one with “2 pizzas + 1 burger”.
Makes sense — more goods, more satisfaction.
3. They Never Intersect
Each curve represents one specific level of satisfaction.
If two curves crossed, it would mean one combination gives you two different satisfaction levels, which is impossible.
4. They Are Convex to the Origin
This simply means the curve bends inward.
Why?
Because the more you have of a good, the less willing you are to give up the other good.
Example:
If you already have 5 burgers, giving up 1 burger for 1 extra pizza is no big deal.
But if you only have 1 burger, giving it up suddenly hurts more.
Convex shape = human behavior.
Marginal Rate of Substitution (MRS)
This is an important idea that comes along with indifference curves.
MRS tells you how much of Good B you are willing to give up to get one more unit of Good A while staying equally satisfied.
It explains how your trade-offs change as you consume more of one good.
Example:
When you're overloaded with chocolates, you’ll happily give up more chocolates to get one juice.
But if you have only one chocolate left, you’ll be stingy.
MRS decreases as you move along the curve — super natural human behavior.
Real-Life Example
Imagine a playlist.
You have combinations of songs from two artists you like. Different mixes might give you the same overall vibe.
That’s an indifference curve.
Same vibe, different combos.
Economics just gives the curve a formal name.
Conclusion
Indifference curves translate human preferences into a visual form.
They’re a powerful way to understand how people make choices, trade-offs, and decisions — all while trying to maintain the same level of happiness.
Even though the graph looks technical, the idea behind it is something you do every single day without even noticing.
:max_bytes(150000):strip_icc():format(webp)/marginalutility-cff85ddfd620484f8afbf9d3f6cf4b74.jpg)
:max_bytes(150000):strip_icc():format(webp)/TermDefinitions_Utility-e42a7528caa347f9b1af149065ab2b9d.jpg)